

Does trying to figure out your agent make you feel like Tony Soprano dealing with another deal gone south? Well Agent Debugger may just be your saving grace!
So far in this series we’ve installed the Copilot Agent Kit, configured it, explored the Agent Inventory, and put the Compliance Hub through its paces. This time, we’re tackling a problem every maker knows all too well: why on earth did my agent do that?
That’s exactly where the Agent Debugger comes in. It lets you replay what *actually* happened behind the scenes, step by step, so you can stop guessing and start fixing.
🔍 Getting started with the Agent Debugger
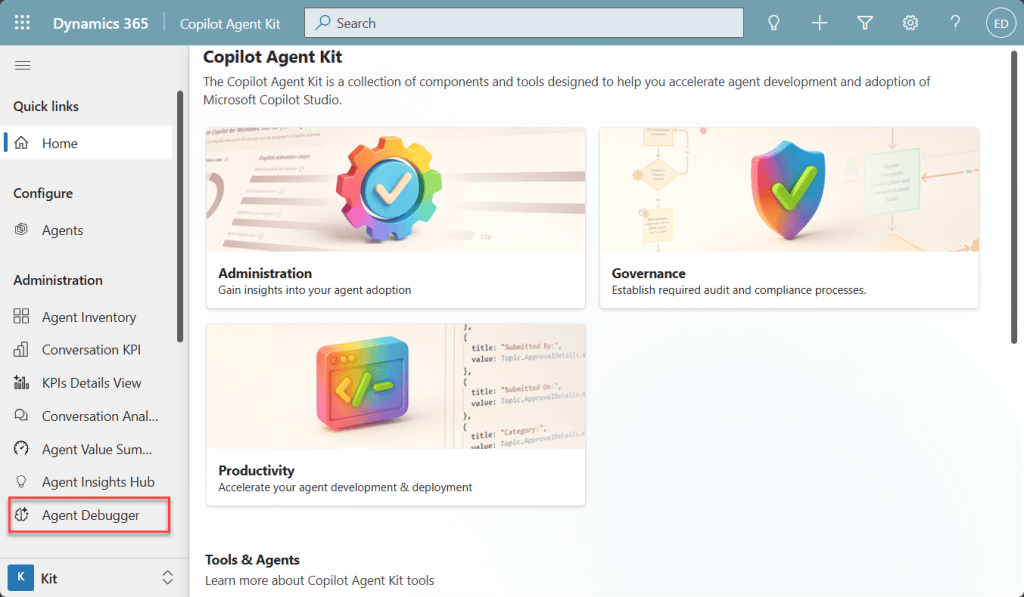
When we open the Copilot Agent Kit, we can access the Agent Debugger from the Administration menu on the left-hand side.
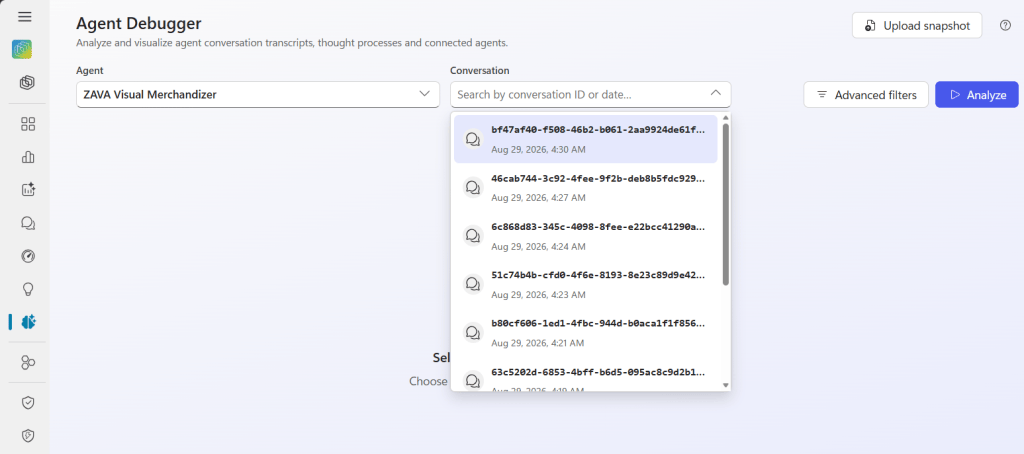
This will open the Agent Debugger screen. Now we need to give the tool a conversation to analyse and there are two ways we can do this. We can either upload a conversation snapshot file directly via the button in the top left corner, or we can use the dropdown menus to search for an existing agent and any conversations that have been logged against it. It is important to note that Agent Debugger has access to 50 of the most recent conversations via the dropdown. If you want to find a specific conversation, you’ll need to feed it that conversation ID. Once you have selected your conversation, the Analyse button will become available.
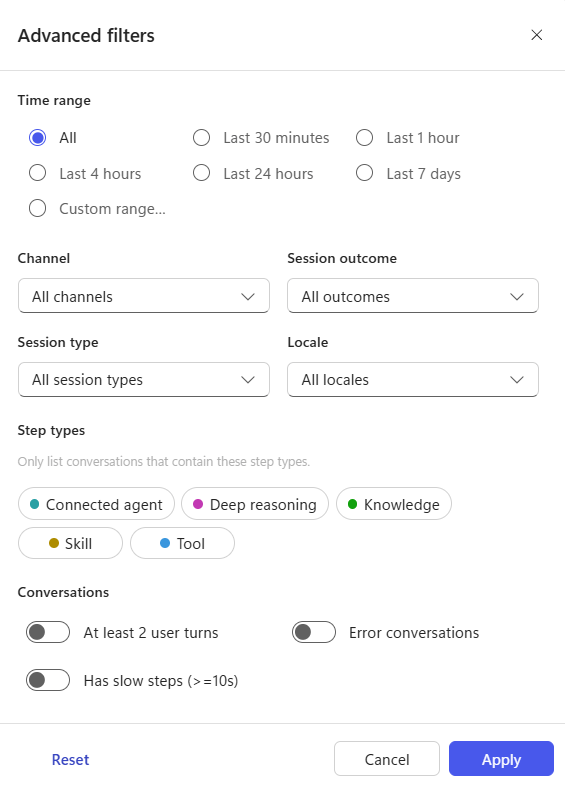
There is also an Advanced Filter button. If you’re looking for a specific conversation from an agent that meets certain criteria, then this button will help you out:
Another really fun feature the team have recently added in – if a conversation spans multiple sessions, a dropdown will appear allowing you to view the conversation in sections during a specific session. They’ve thought of everything!
📊 What the Agent Debugger shows you
After a few moments, the Agent Debugger starts returning information about the conversation you selected. There are a few different views to explore, so let’s walk through each one.
First up is the Performance Timeline. This shows us how long each action within the conversation took, with the longest-running action helpfully displayed right at the top. It will also show you if any steps within the conversation failed, but we will dive deeper into that shortly.
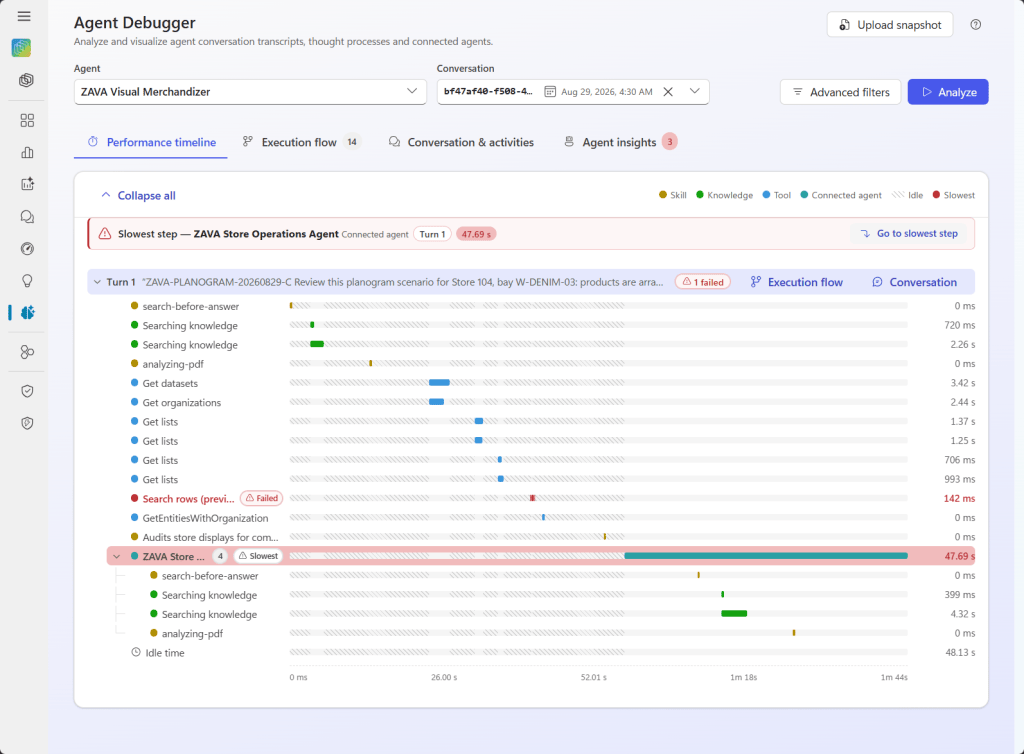
Let’s move over to the Execution Flow, where we get a visual of the step-by-step process the agent took to complete the requested action, including any tools it called along the way. In this example I can see that this request took a total of 1min and 44seconds. Now I can see exactly what steps this agent took, what skills and tools it called and any reasoning it did. First, I can see it failed at the SearchRows action (more on this in just a moment) and then some reasoning further below on what to do next:
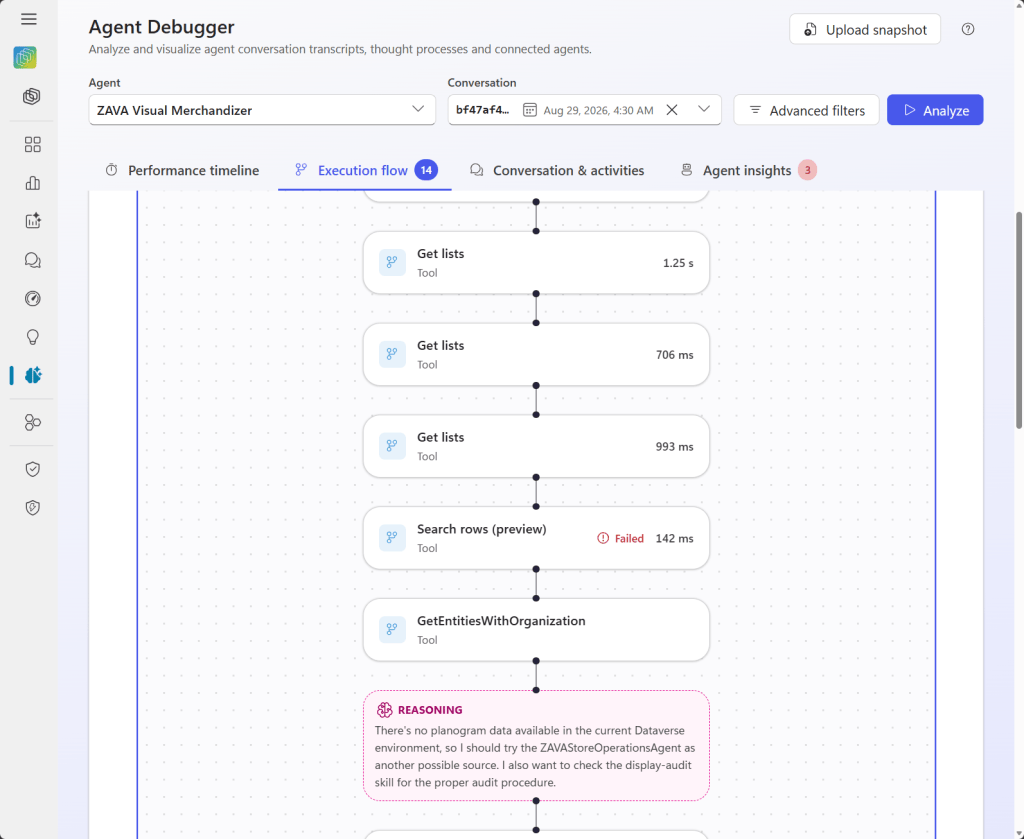
We can see that based on the agent’s reasoning on why the action failed, it decided to hand off to a connected agent. We are even able to see the process within that agent:
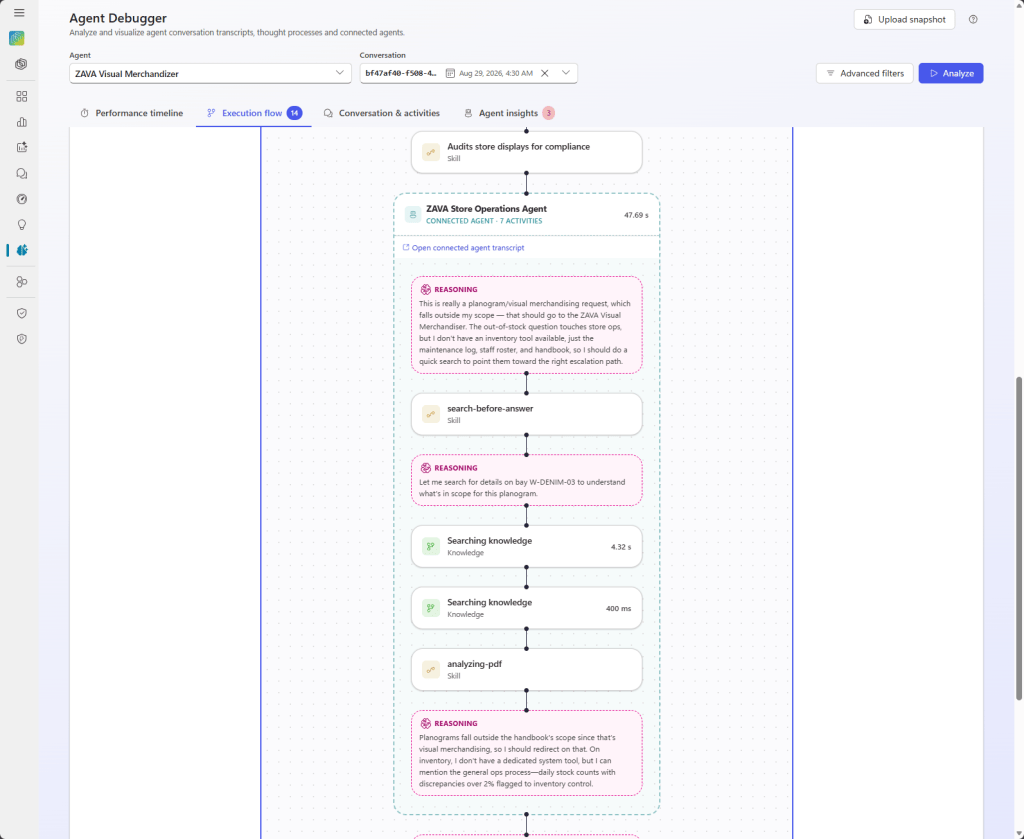
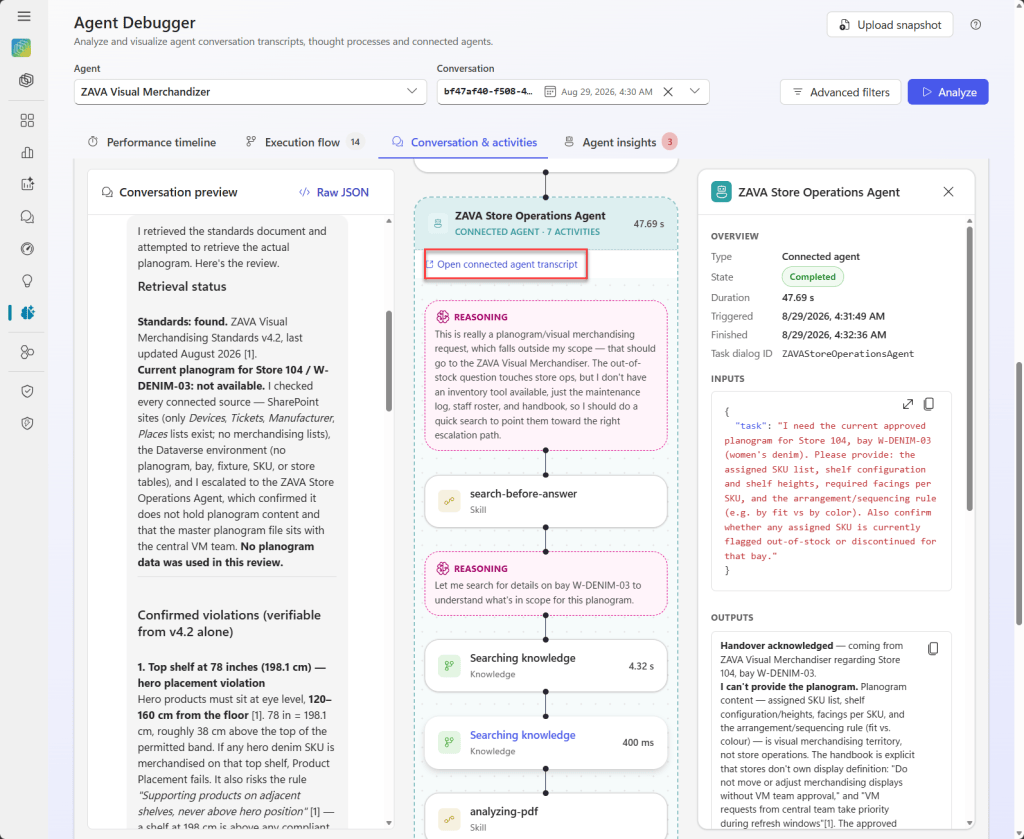
That agent then reasons that it can’t help with the request but does pass back some helpful information, which the originating agent uses to reason and provide a final response. Let’s look at how this conversation went in real time.
The Conversation & Activities tab gives us a lovely picture of what the *end user* actually saw during the conversation. First, let’s look at why that get rows tool failed and how the agent attempted to recover via the chat.
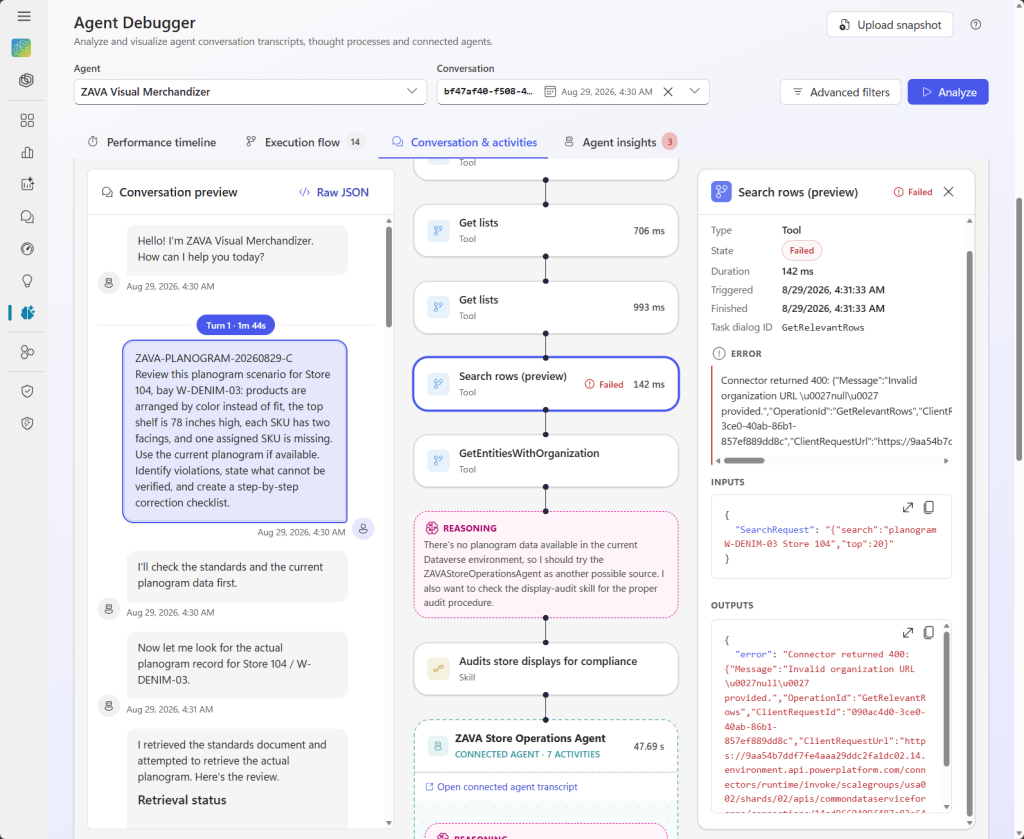
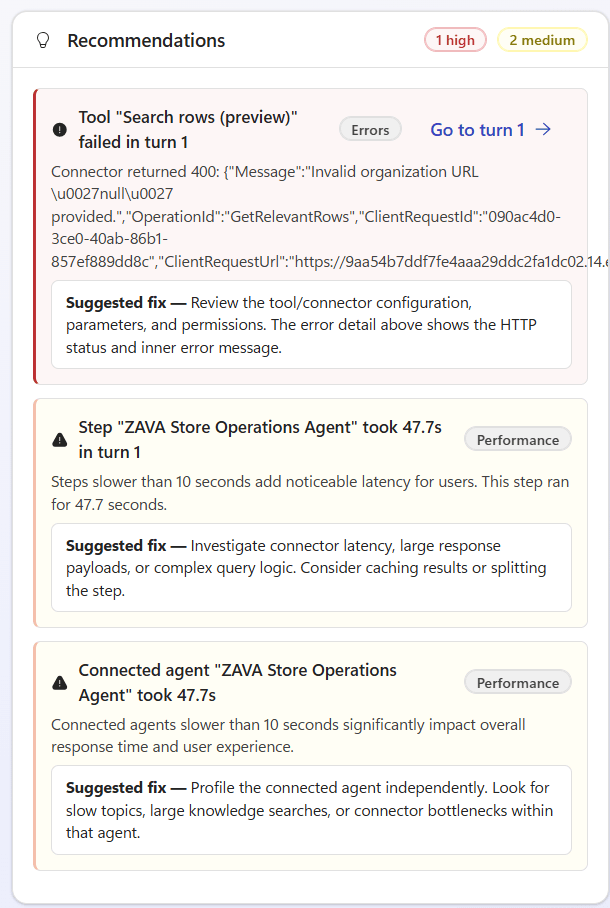
It appears as though there was a configuration issue with the connector, so the agent was unable to use it correctly. As an admin, that’s something I can now fix to help the agent run smoothly.
If we look a little further below, we can see how the agent attempted to use reasoning and handed off to a connected agent. We are even able to open the transcript with the connected agent from here for further insights:
Last but absolutely not least, we have Agent Insights which pulls everything from the previous three tabs into one single place. It allows us to see all of the issues with the agent and includes recommendations on how to improve performance.
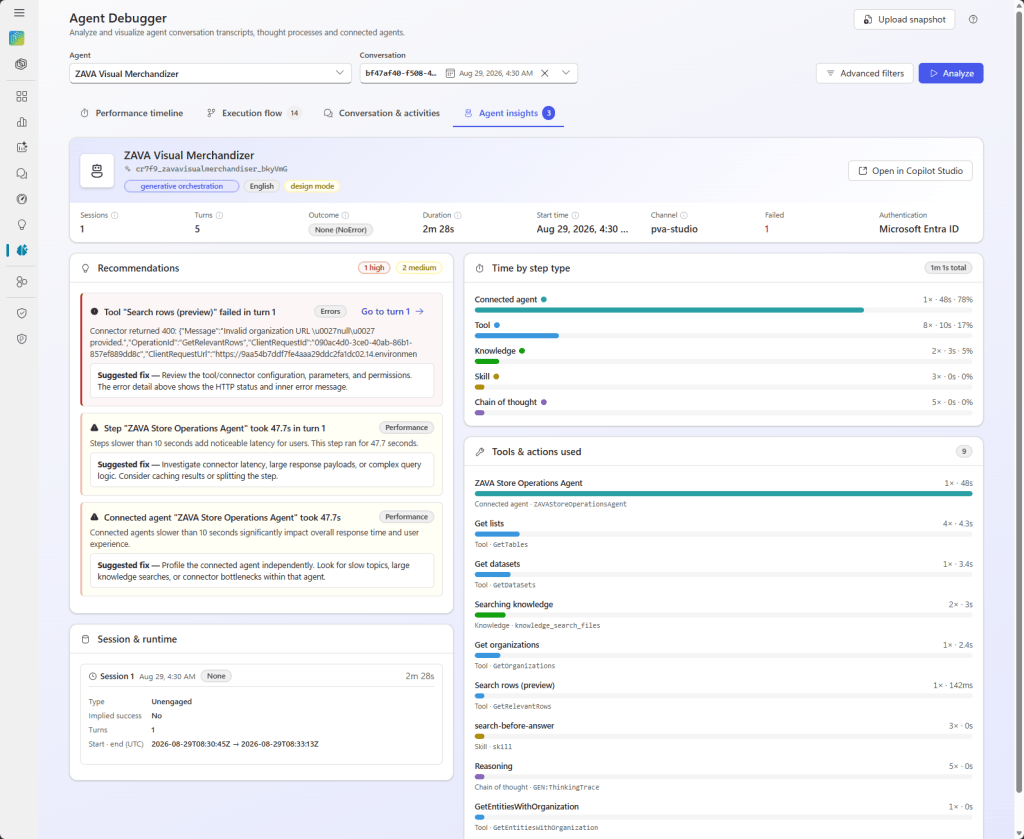
The header here will show is detailed info on the conversation:

I can see there were five turns that happened in one session. The session didn’t have an outcome here. An outcome will show as resolved, abandoned, error or none. We can see where the conversation happened – here it is tagged as design mode and pva-studio, so I know this was done as a test. I can see how many steps failed and what kind of authentication was used.
Now let’s get into the agent itself starting with Recommendations. This is always the first place I look at when I have an issue with an agent. It will show me suggested fixes with high-priority recommendations at the top. Unsurprisingly, it recommends I fix the connector first, which I agree with, and then recommends I look at improving the Store Operations agent to see if I can improve performance there, too.
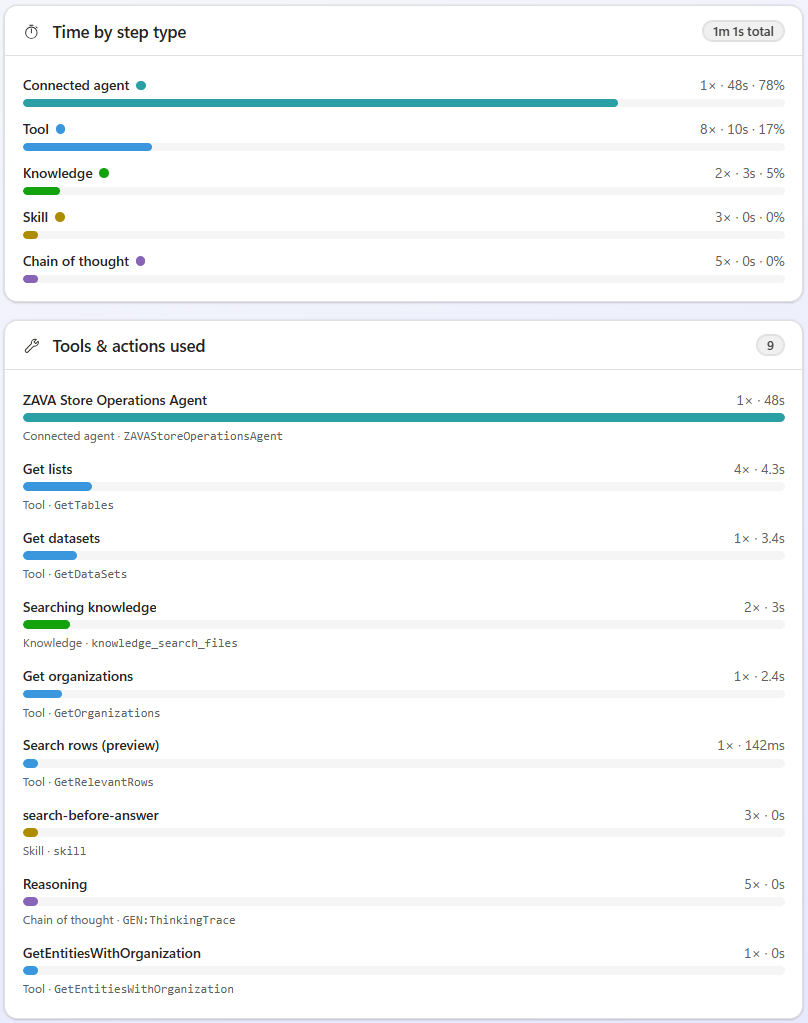
On the right, we get metrics on how the agent used various components and how long it took. Now I can see why there’s a recommendation to try speed up my connected agent.
🏁 Wrapping up
The Agent Debugger helps you quickly and efficiently work out why your agent is slow, why something is broken, and exactly where the problem lives so you can address it fast and keep everything running smoothly. For me, it’s the difference between staring at a chat window scratching my head and confidently pointing at the exact step that needs attention. Instead, I can spend all that saved time catching up on watching the Sopranos!


One thought on “Copilot Agent Kit: The Agent Debugger”